Authors: Kenneth D. Mankoff1,2, Fabien Maussion3
Affiliations:
1NASA Goddard Institute for Space Studies, New York, NY, 10025 USA
2Autonomic Integra LLC, New York, NY, 10025 USA
3School of Geographical Sciences, University of Bristol, Bristol, UK
License: CC-BY
Executive Summary
In prep
1Purpose and scope
Deliverable #1 of the International Association of Cryospheric Sciences (IACS) working group on the delineation of glaciers, ice sheets, and ice sheet basins aims to provide an overview of the current state of ice sheet and glacier delineation using several commonly used and widely cited products. These include datasets used by the glaciological community (e.g., BedMachine), observationally derived boundaries (e.g., RGI 7.0), and some regional climate model masks.
The goal of this report is to provide a summary of the current state of ice sheet and glacier delineation products.
2Data collection and methods
We reached out to the glaciological community (CRYOLIST announcement) and gathered a group of polar data experts, producers and users. We asked our members to provide information on their use of ice sheet and glacier masks and boundaries and collected the information as GitHub Issues.
The following report is based on this initial consultation and contains new analyses of the presently available datasets. We provide an explanation of which products rely on which other products based on a community survey, and graphical statistical summaries showing the product union (X \union Y, i.e., area of overlap) and the product not-union (X \union Y’, i.e., area of product X outside of product Y). The regions highlighted in this report are illustrative examples of key issues and are not intended to be exhaustive or comprehensive.
3Products
We list all products either introducing or using a Greenland or Antarctic mask. A “mask” represents a gridded or vector file defining the spatial domain of a specific product.
This list is meant to be as exhaustive as possible. If a product is missing, please reach out.
3.1Greenland
| Name | Data citation | Science citation | Details | Comments |
|---|---|---|---|---|
| MEaSUREs ITS_LIVE Greenland Monthly Ice Masks, Version 1 | Gardner (2023) | Greene et al. (2024) | IACS | |
| PISM | IACS | |||
| NORCE-CISM | IACS | |||
| MAR | IACS | |||
| NHM-SMAP | IACS | |||
| ISSM | IACS | |||
| MetUM | IACS | |||
| GlacierMIP | Hock et al. (2019) | IACS | ||
| RGI 7.0 | IACS | |||
| BedMachine | Morlighem et al. (2022) | Morlighem et al. (2017) | IACS | |
| PROMICE | Citterio & Ahlstrøm (2022) | Citterio & Ahlstrøm (2013) | ||
| ESA CCI | Harper et al. (2023) | |||
| Mouginot (a.k.a IMBIE Greenland) | Mouginot & Rignot (2019) | Mouginot et al. (2019) |
3.2Antarctica
| Name | Data citation | Science citation | Details | Comments |
|---|---|---|---|---|
| MEaSUREs ITS_LIVE Antarctic Annual Ice Masks, Version 1 | Greene et al. (2022) | Using only 2020 | ||
| PISM | IACS | |||
| NORCE-CISM | IACS | |||
| MAR | IACS | |||
| NHM-SMAP | IACS | |||
| ISSM | IACS | |||
| MetUM | IACS | |||
| HIRHAM5 Antarctic ice mask | IACS | |||
| GlacierMIP | Hock et al. (2019) | IACS | ||
| RGI 7.0 | IACS | |||
| BedMachine | Morlighem (2022) | Morlighem et al. (2019) | IACS | |
| Bedmap3 | Pritchard et al. (2024) | Pritchard et al. (2025) |
4Results and discussion
The masks or boundaries themselves are rarely the primary focus of the work — exceptions include the RGI, Greene et al. (2024), and a few others (which ones?). For example, the BedMachine mask is a necessary input to perform the ice thickness inversion, while the MAR ice extent mask is required to accurately represent ice–atmosphere interactions and compute mass balance in MAR. The same is true for many of the other products mentioned above. Their primary focus is to provide a specific product (e.g., ice velocity, ice thickness, mass balance, etc.), with the mask being a secondary consideration.
For the products that are not mask producers but rather mask users, the choice of which mask to adopt appears to be based on reasonable and justifiable decisions. However, these decisions are often driven by ease of use, familiarity, or reliance on local or national datasets—rather than careful consideration of overlap (or lack thereof) with peripheral products such as the RGI, or the ease of comparison with downstream products.
4.1Greenland
Several Greenlandic products use the BedMachine mask (which is based on the GIMP mask) or the GIMP mask directly, which at its release may have been the most complete, accurate, and highest resolution mask. However, the GIMP mask is now based on a 10 year old paper (Howat et al. (2014)) and seven-year-old product (Howat et al. (2017)), and the mask itself uses data spanning 15 years, which is problematic considering the large annual changes in Greenland.
A detailed examination of eight Greenlandic products (BedMachine, PROMICE, MAR, RACMO, ESA CCI, GIMP, Mouginot, and RGI v7 region 05) is shown below for six regions: Qaanaaq, Sisimiut, near the Geikie Plateau, the southern tip of Greenland, central east Greenland near Daugaard-Jensen Gletsjer, and the east Greenlandic Kangerlussuaq fjord.
For all figures below, the RGI version used is v7.0. In this version, glacier outlines in Greenland correspond to connectivity level 0 and 1 in Rastner et al. (2012) (level 2 - strongly connected - has been removed from the RGI with version 7).
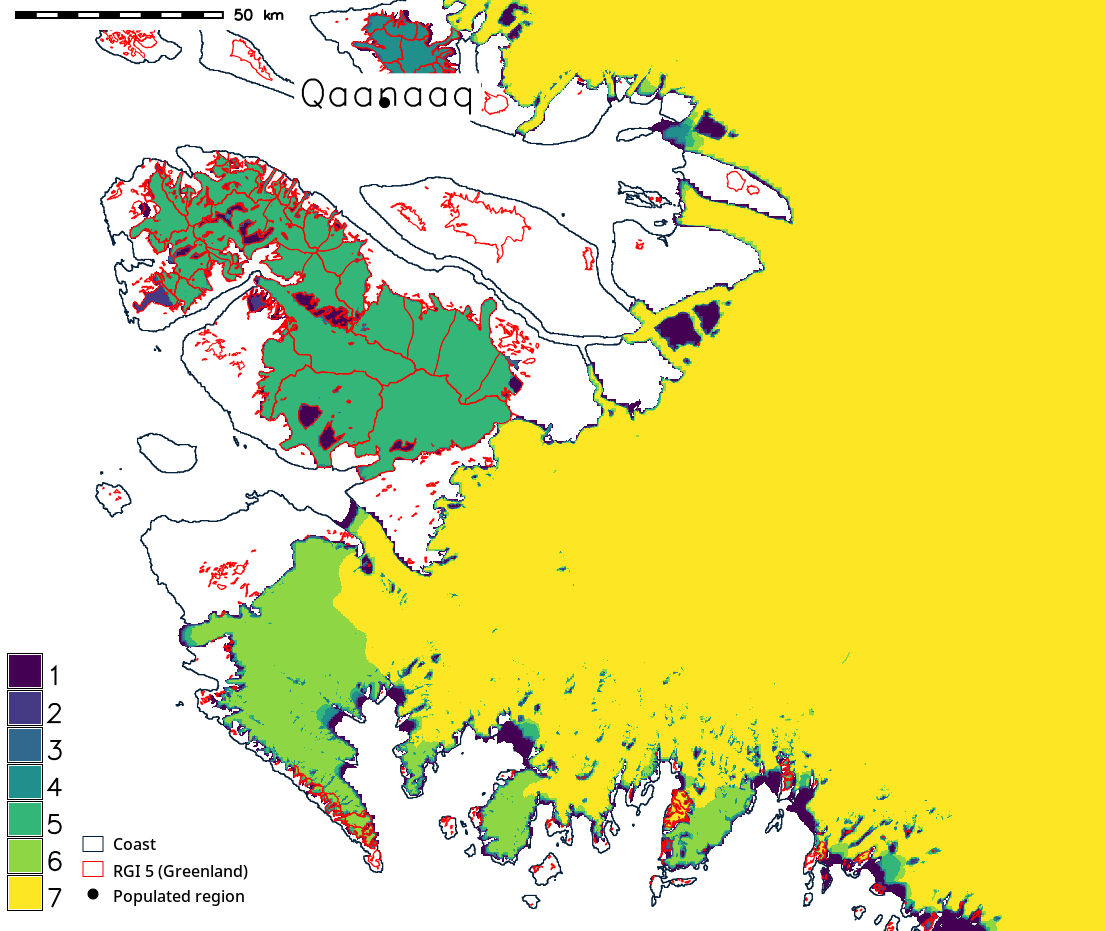
Figure 1:Overlap map of eight masks (BedMachine, PROMICE, MAR, RACMO, ESA CCI, GIMP, Mouginot, and RGI v7 region 05) near Qaanaaq, Greenland. The seven filled colors represent number of overlapping products when each is limited to the main (connected) ice sheet. The eight product is RGI v7 region 05 (peripheral Greenland, connectivity level 0 and 1) shown as a red outline. This graphic shows that some small areas that are in the RGI peripheral region are covered by two, three, or even seven of the other main ice sheet masks. Regions of the ‘main ice sheet’ are also defined differently among masks.
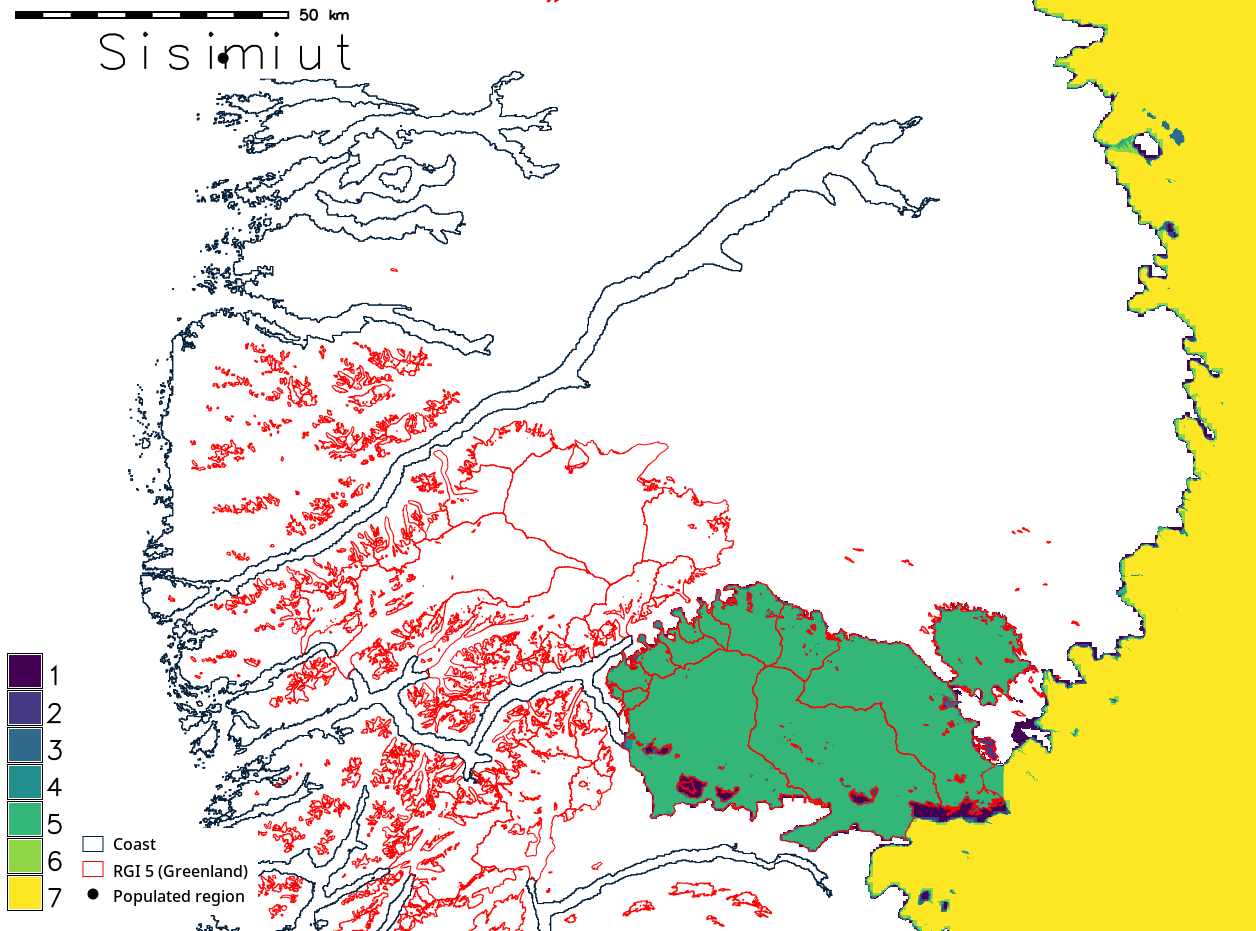
Figure 2:Same display as Figure 1, but here showing a large area within in the RGI peripheral region that is covered by five of the other main ice sheet masks.
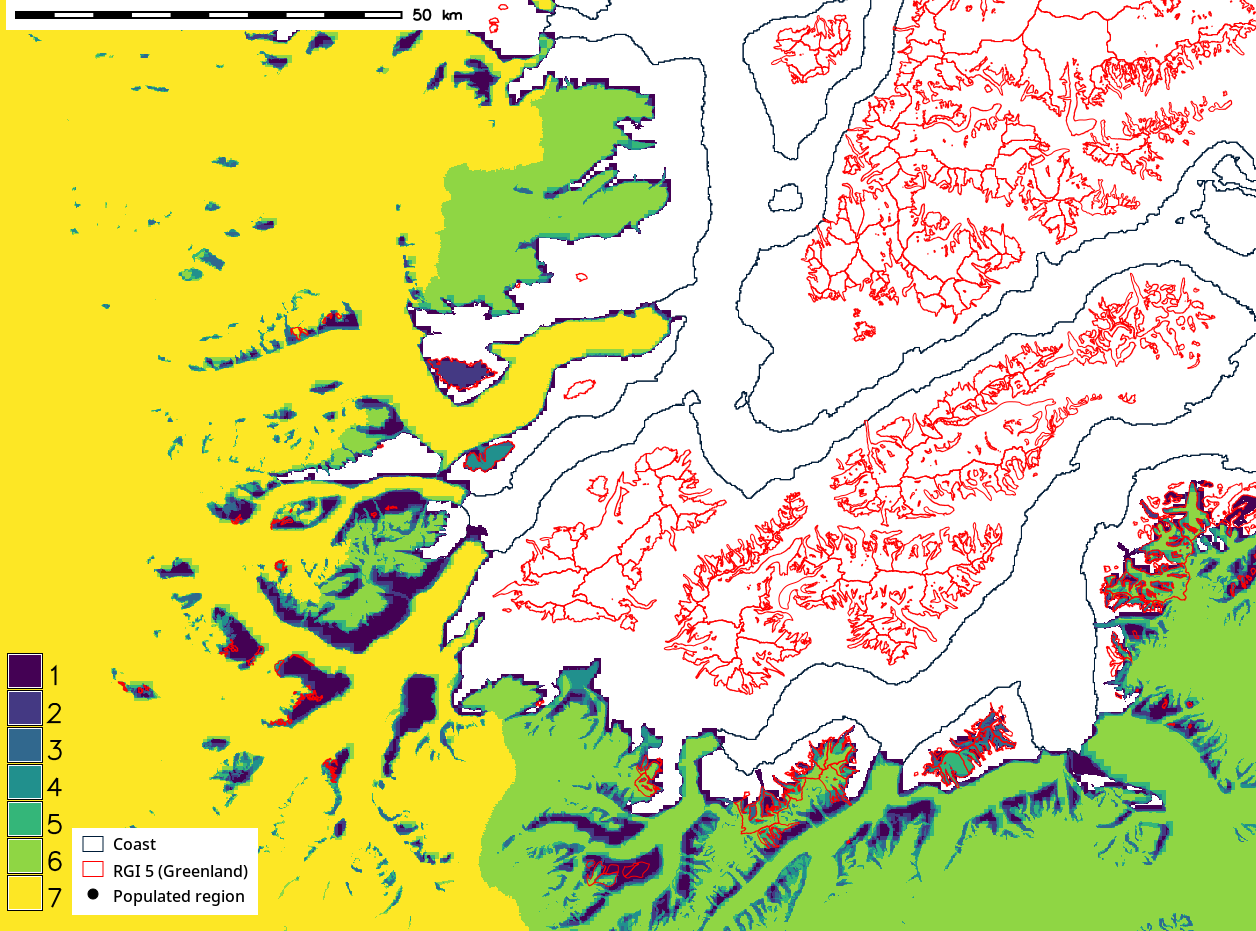
Figure 3:Same display as Figure 1, The Geikie Plateau (southeast) shows one mask does not cover this area, as coverage drops from seven to six.
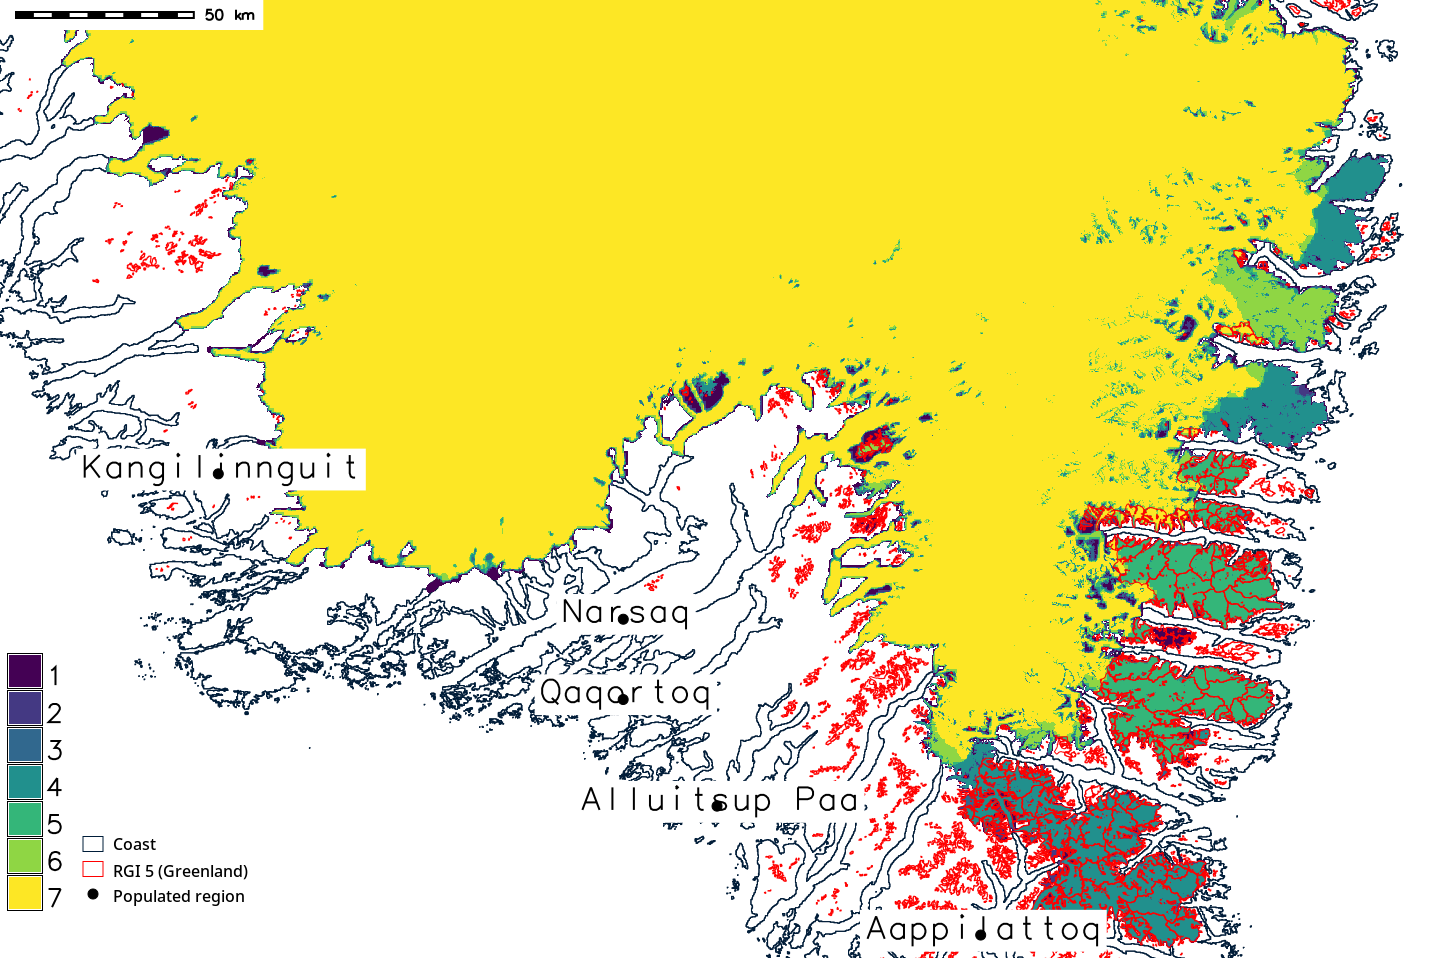
Figure 4:Same display as Figure 1, but here showing the southern tip of Greenland. Large areas covered by the RGI peripheral glacier product are also covered by main ice sheet mask products, and large areas not covered by RGI are only covered by some of the seven mask products.
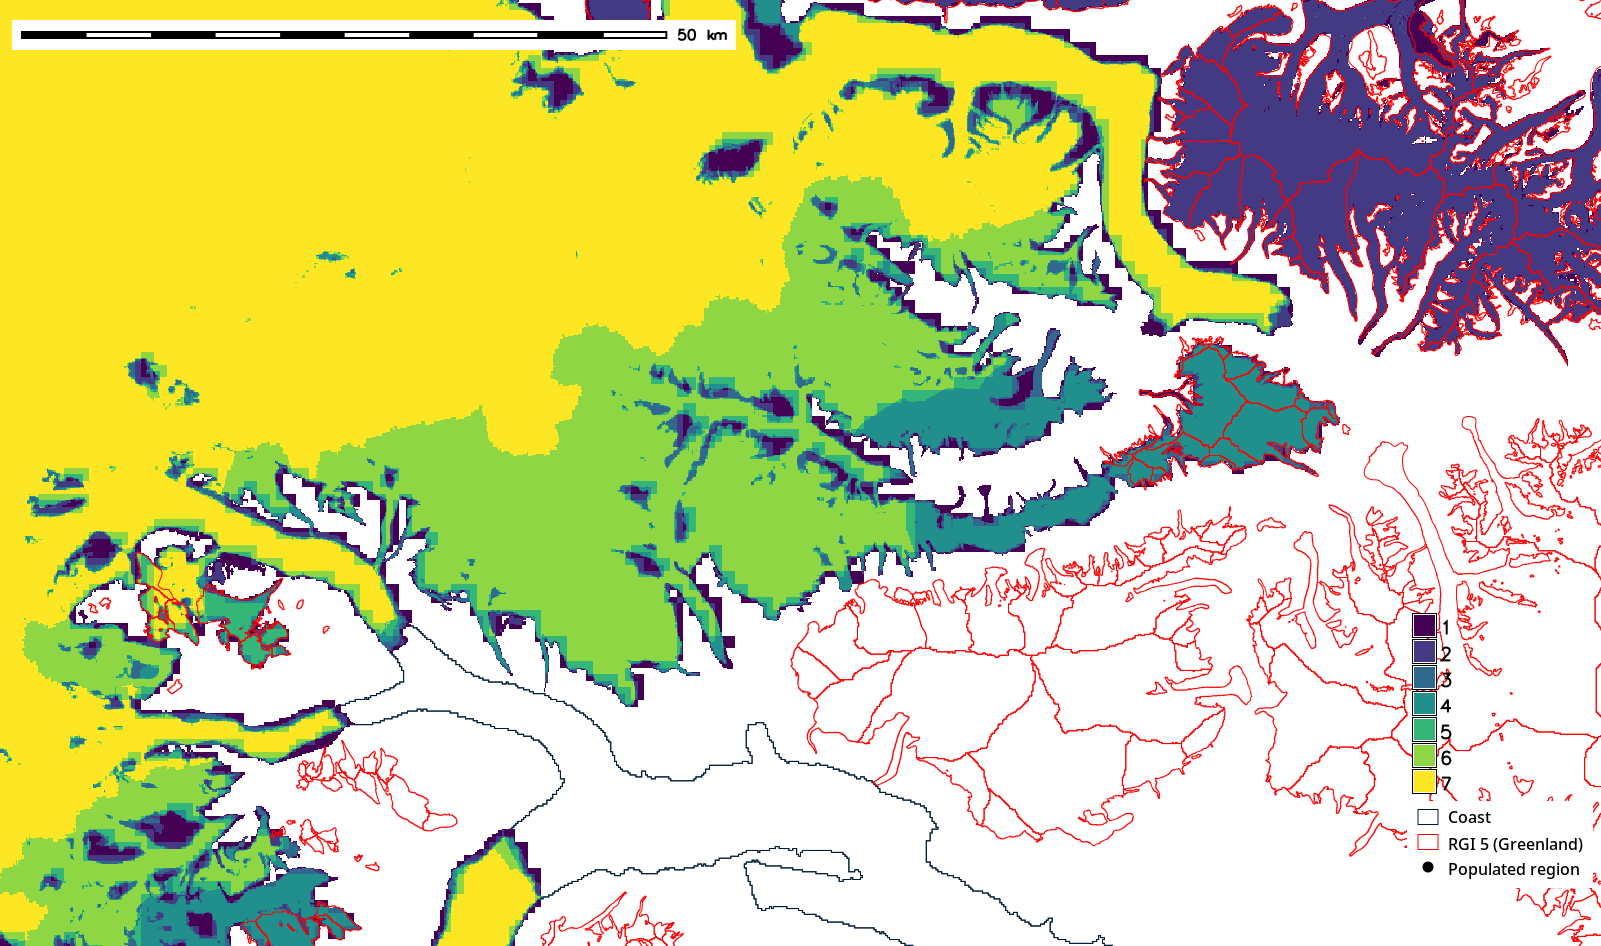
Figure 5:Same display as Figure 1, but here showing central west Greenland near Daugaard-Jensen Gletsjer.
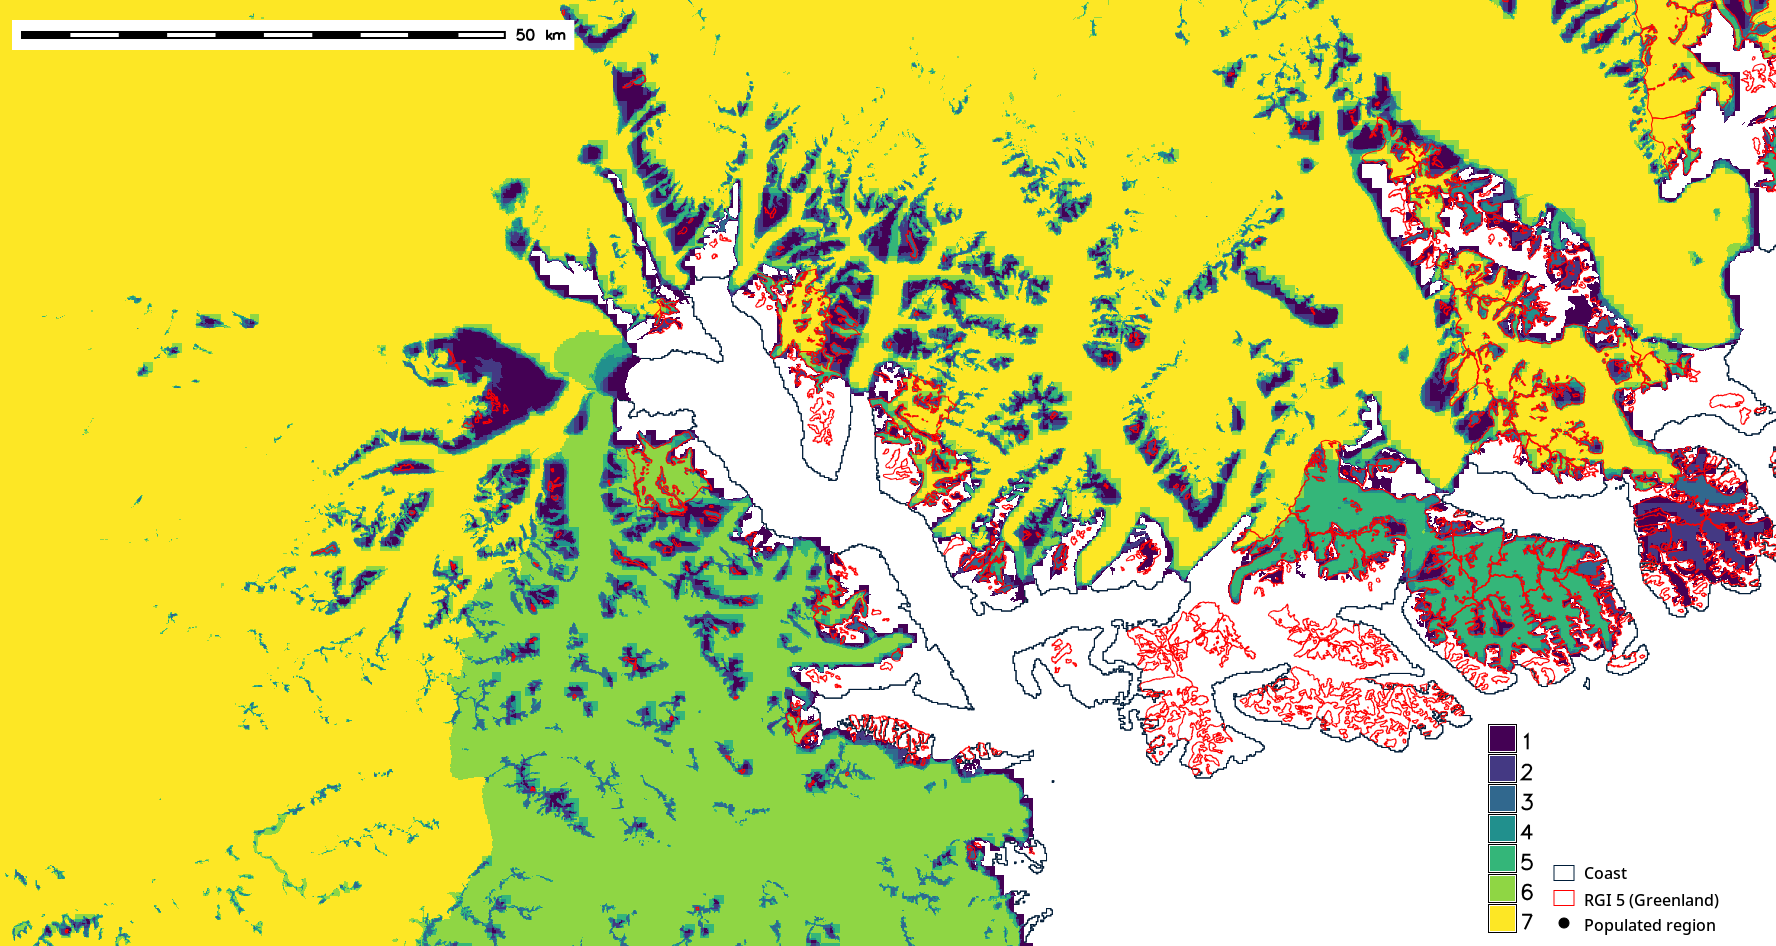
Figure 6:Same display as Figure 1, but here showing Kangerlussuaq Fjord, West Greenland.
The above figure provides a qualitative view of overlapping masks in a few regions of Greenland. The figures below show a quantitative display of more masks and what areas of each mask either overlaps the other masks, or is outside of the other masks.
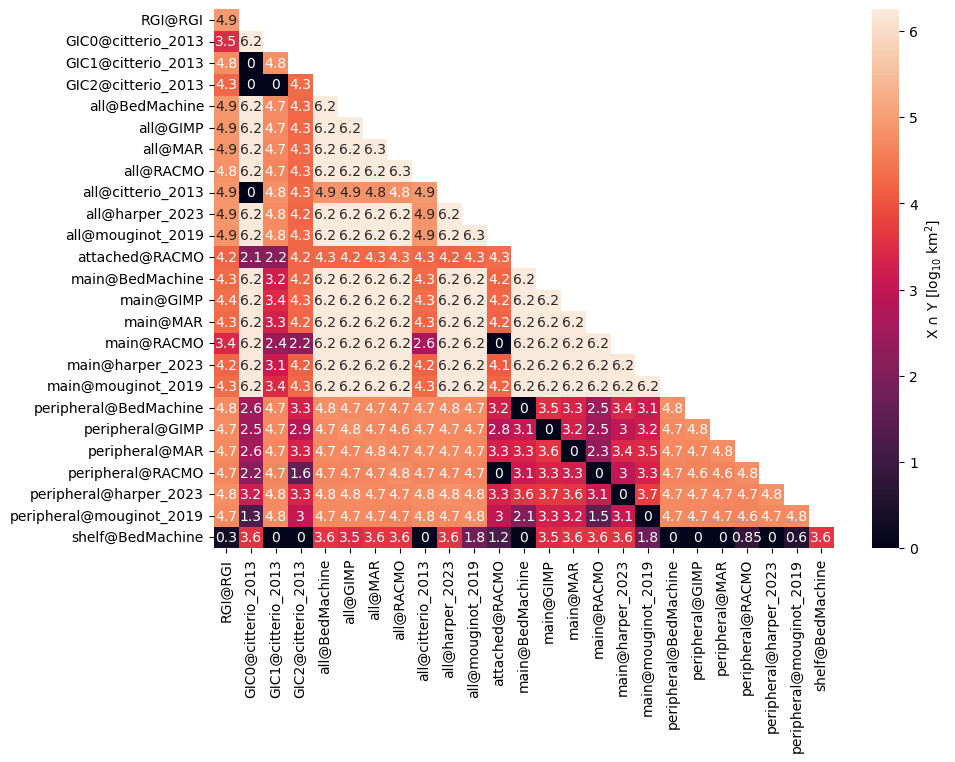
Figure 7:Overlapping areas between masks on X axis and on Y axis in Greenland. Scale (both number and color) is logarithmic. The diagonal is the area of a product (100 % overlap with itself). An example interpretation of this graphic follows the RGI column (left column) starting at the bottom row. The bottom left square reports 10 km (~2 km) area overlap between RGI and areas flagged as “ice shelf” in BedMachine. The third row up shows overlap between RGI and peripheral glaciers in the ‘harper_2023’ product is 10 km (~63096 km). More interesting is overlap between RGI and the ‘main@’ rows, which are the primary ice sheet in those products. RACMO only overlaps RGI by 10 km (~2,500 km) but most other products overlap by ~10x as much (seen by the difference between ~10 and ~10). The largest overlap is GIMP with 10 km (~25,000 km).
Data available as a csv file.
An alternative view, rather than overlap, is area of product X outside of product Y. Because overlap is commutative (X overlap Y is the same as Y overlap X) the above figure is half empty. However, X not in Y is different than Y not in X, so the following figure contains twice as much information and occupies twice the area (same information density).
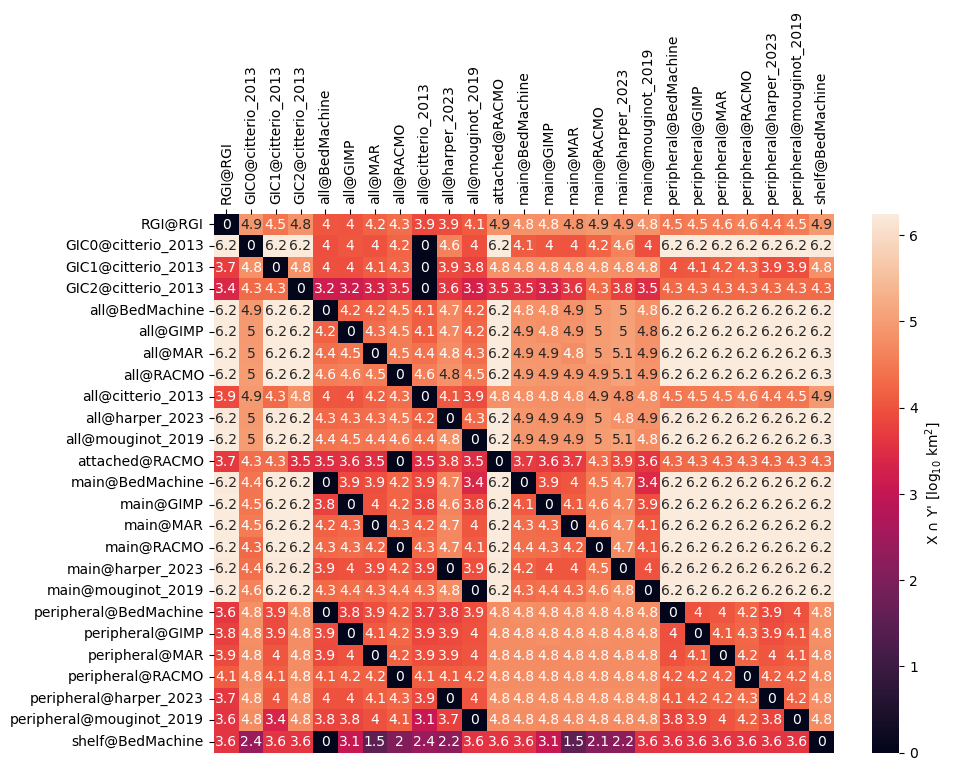
Figure 8:Non-overlapping areas between masks on X axis and on Y axis in Greenland. Scale (both number and color) is logarithmic. The diagonals are 0 because a product cannot be outside itself. An example interpretation of this graphic follows the RGI column (left column) starting at the bottom row. The bottom left square reports 10 km (~4,000 km) area of BedMachine ice shelf outside of the RGI peripheral glaciers. The third row up shows the ‘harper_2023’ peripheral glaciers have 10 km (5,000 km) outside of the RGI peripheral glaciers. Because this graphic is log scale, a change between two values of magnitude 1 represents ~10 % of the original values, and magnitude 2 (e.g., 10 to 10) represents 1 %.
Data available as a csv file.
4.2Antarctica
The state of masks in Antarctica is less homogeneous than in Greenland. The BedMachine mask uses unpublished data (see GH Issue), and many products then use the BedMachine mask. However HIRHAM uses a 1994 USGS mask, and MetUM uses a mask from AVHRR data from the early 1990s.
An examination of seven Antarctica products (BedMachine, ESA CCI, Rignot (IMBIE), Greene et al. (2022), NSIDC 0709, Bedmap3 and RGI region 19) is shown below for two regions: Wilkins ice shelf and Abbott ice shelf.
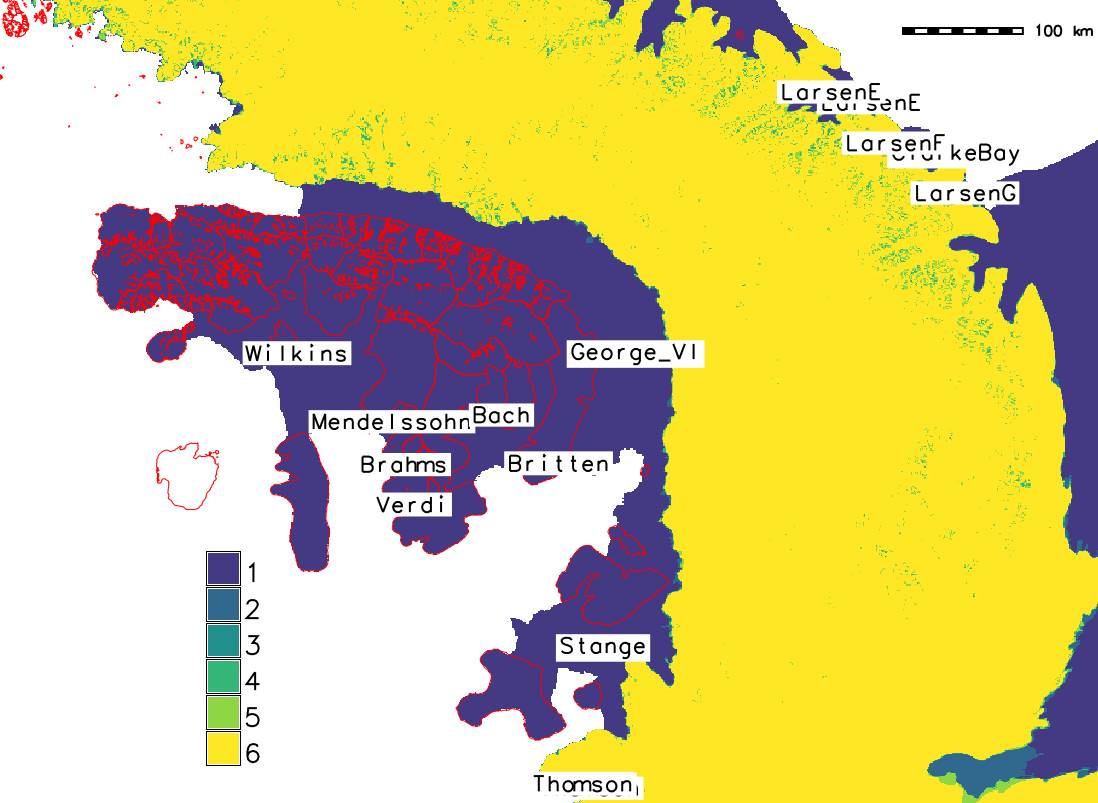
Figure 9:Overlap map of seven masks (BedMachine, ESA CCI, Rignot (IMBIE), Greene et al. (2022), NSIDC 0709, Bedmap3, and RGI region 19) near Wilkins ice shelf, Antarctica. The six filled colors represent number of overlapping products when each is limited to the main (connected) ice sheet. The seventh product is RGI region 19 (peripheral Antarctica) shown as a thin red outline. This graphic shows one product ‘main ice sheet’ includes the ice shelves and coastal islands.
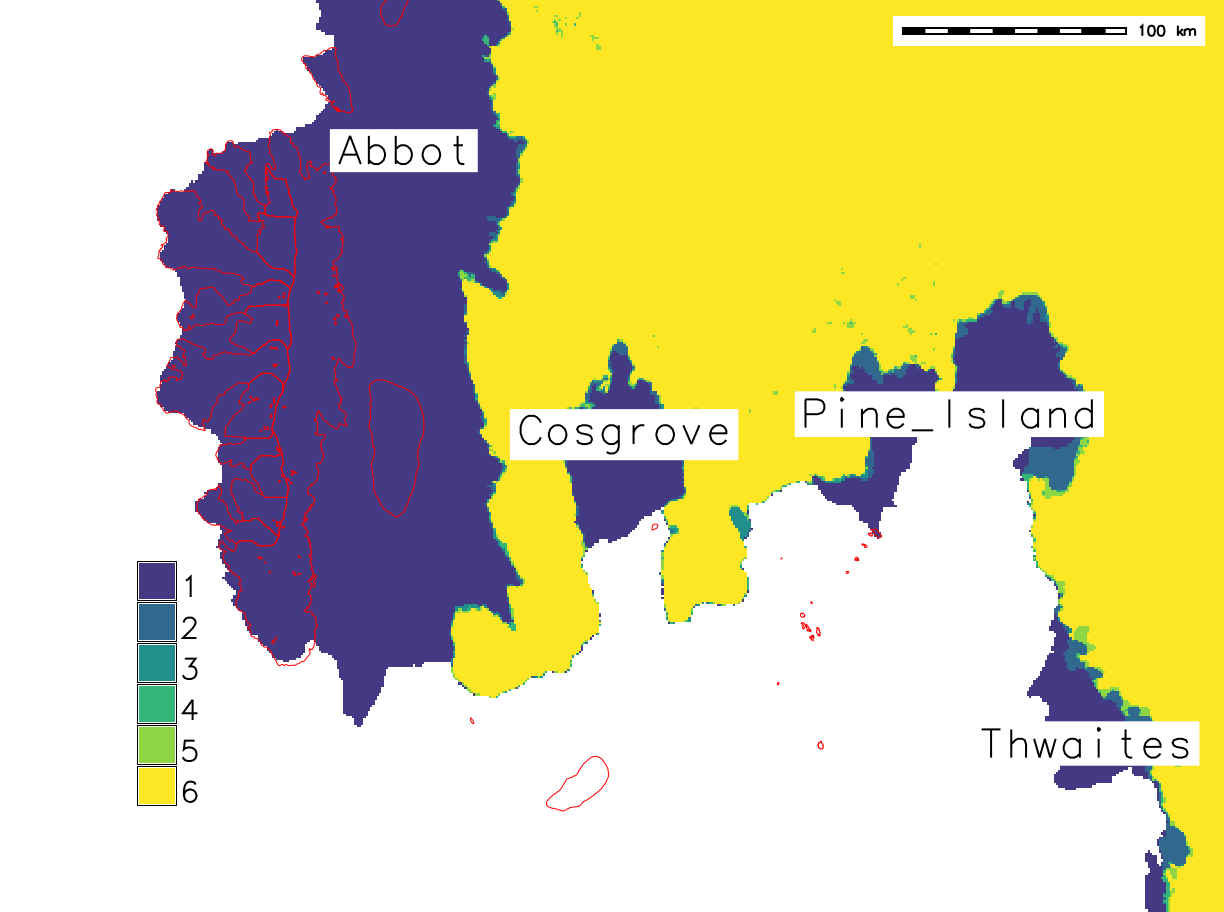
Figure 10:Same display as Figure 9, but near Abbott, Pine Island Glacier, and Thwaites ice shelves. This graphic shows a) general outline misalignment, and b) One product includes the ice shelves and coastal islands.
The above figure provide a qualitative view of overlapping masks in two regions of Antarctica. The figures below show a quantitative display of more masks and what areas of each mask either overlaps the other masks, or is outside of the other masks.
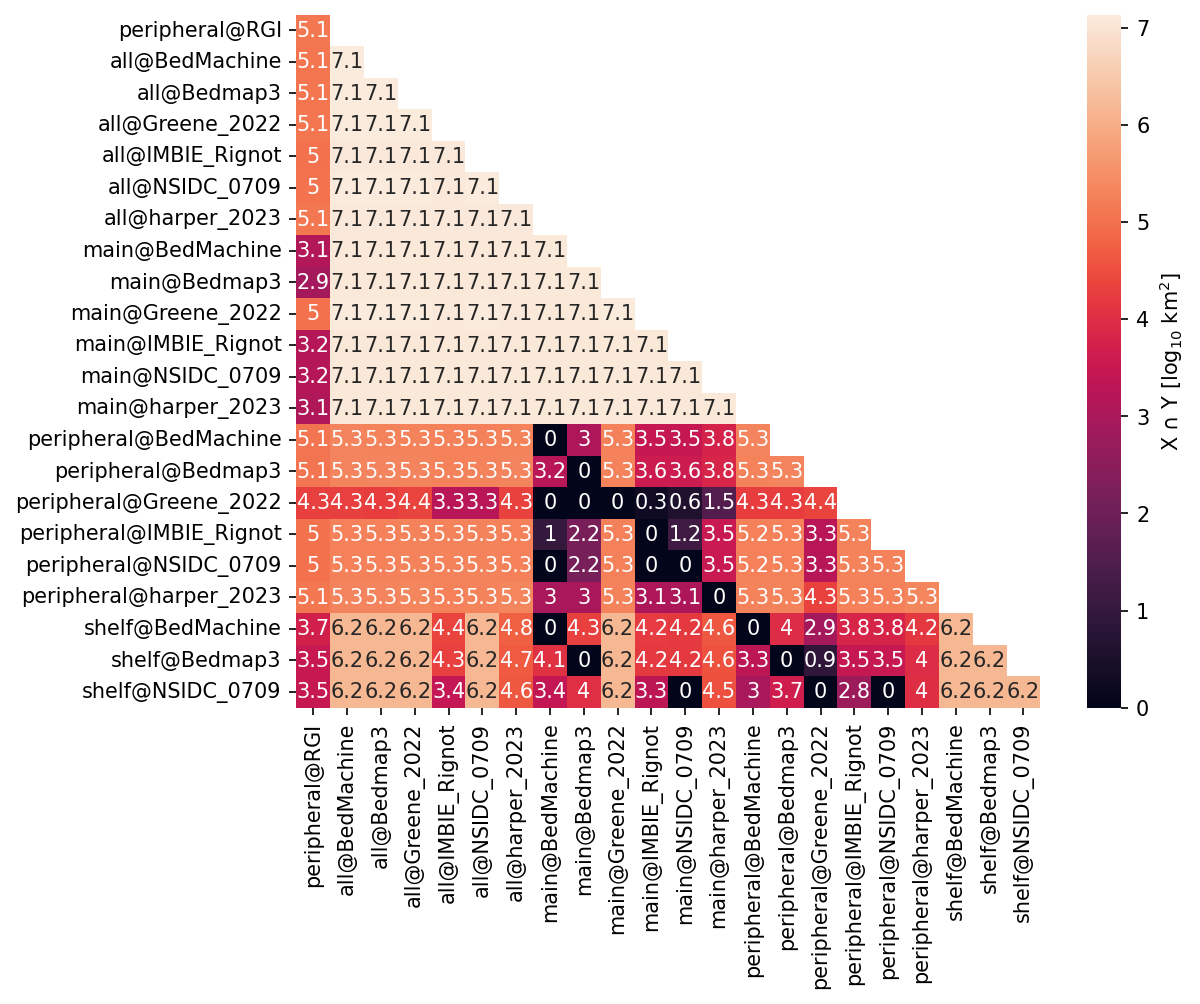
Figure 11:Overlapping areas between masks on X axis and on Y axis in Antarctica. Scale (both number and color) is logarithmic. The diagonal is the area of a product (100 % overlap with itself). Of interest, the dark (low values) in the column over ‘peripheral@RGI’ shows overlap between RGI peripheral region and all other products. This overlap is sometimes small (~10 or 1000 km), but sometimes 10 or 100 times as large (e.g., 10 km).
Data available as a csv file.
An alternative view, rather than overlap, is area of product X outside of product Y. Because overlap is commutative (X overlap Y is the same as Y overlap X) the above figure is half empty. However, X not in Y is different than Y not in X, so the following figure contains twice as much information and occupies twice the area (same information density).
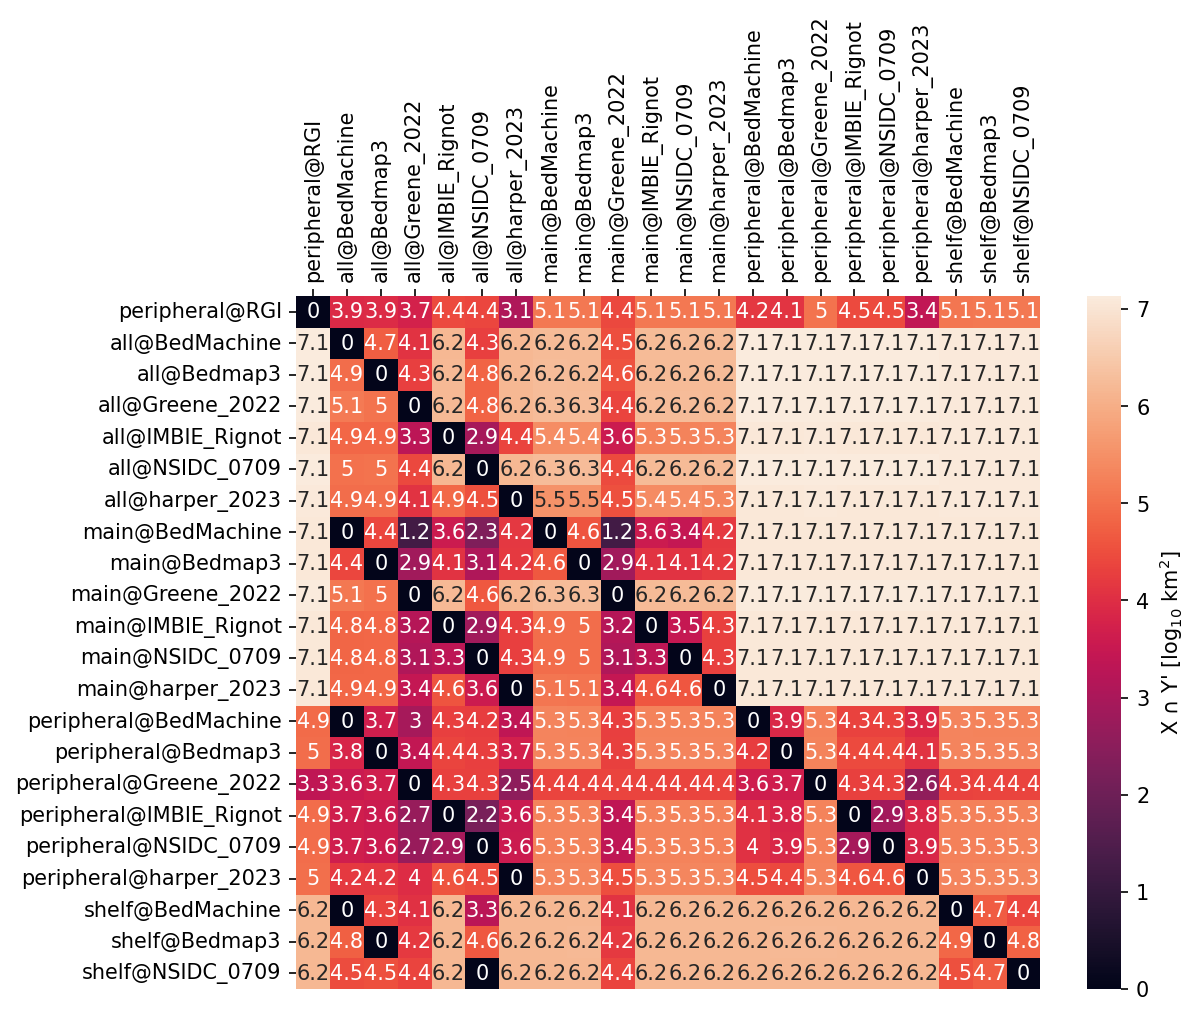
Figure 12:Non-overlapping areas between masks on X axis and on Y axis in Antarctica.
Data available as a csv file.
5Summary
A community survey of existing ice masks and boundary products shows a wide range of products are used (as already documented in existing peer reviewed literature). The impact of the different masks are all quantified against each other in terms of area of overlap (union) and non-overlap (non-union). We note that reporting results in terms of area (e.g., km) is a great measure of impact because the largest changes occur near the ice sheet edge, meaning small changes in area can have disproportionately large impact on change in mass balance. However, reporting results in area units is significantly easier, for a variety of reasons including that area is constant in time while mass flows vary through time, or that we may not have access to the model used with a given mask, and if existing models do not cover the entire mask, we cannot report mass balance for areas outside the model domain.
- Gardner, A. (2023). MEaSUREs ITS_LIVE Greenland Monthly Ice Masks, Version 1. NASA National Snow. 10.5067/579TO87M7IZB
- Greene, C. A., Gardner, A. S., Wood, M., & Cuzzone, J. K. (2024). Ubiquitous acceleration in Greenland Ice Sheet calving from 1985 to 2022. Nature, 625(7995), 523–528. 10.1038/s41586-023-06863-2
- Hock, R., Bliss, A., Marzeion, B., Giesen, R. H., Hirabayashi, Y., Huss, M., Radić, V., & Slangen, A. B. A. (2019). GlacierMIP – A model intercomparison of global-scale glacier mass-balance models and projections. Journal of Glaciology, 65(251), 453–467. 10.1017/jog.2019.22
- Morlighem, M., Williams, C., Rignot, E., An, L., Arndt, J. E., Bamber, J., Catania, G., Chauché, N., Dowdeswell, J. A., Dorschel, B., Fenty, I., Hogan, K., Howat, I., Hubbard, A., Jakobsson, M., Jordan, T. M., Kjeldsen, K. K., Millan, R., Mayer, L., … Zinglersen, K. (2022). IceBridge BedMachine Greenland, Version 5. NASA National Snow. 10.5067/GMEVBWFLWA7X
- Morlighem, M., Williams, C. N., Rignot, E., An, L., Arndt, J. E., Bamber, J. L., Catania, G., Chauché, N., Dowdeswell, J. A., Dorschel, B., Fenty, I., Hogan, K., Howat, I., Hubbard, A., Jakobsson, M., Jordan, T. M., Kjeldsen, K. K., Millan, R., Mayer, L., … Zinglersen, K. B. (2017). BedMachine v3: Complete Bed Topography and Ocean Bathymetry Mapping of Greenland From Multibeam Echo Sounding Combined With Mass Conservation. Geophysical Research Letters, 44(21). 10.1002/2017gl074954
- Citterio, M., & Ahlstrøm, A. P. (2022). Ice extent. GEUS Dataverse. 10.22008/FK2/PRWITW
- Citterio, M., & Ahlstrøm, A. P. (2013). Brief communication “The aerophotogrammetric map of Greenland ice masses.” The Cryosphere, 7(2), 445–449. 10.5194/tc-7-445-2013
- Harper, K. L., Lamarche, C., Hartley, A., Peylin, P., Ottlé, C., Bastrikov, V., San Martín, R., Bohnenstengel, S. I., Kirches, G., Boettcher, M., Shevchuk, R., Brockmann, C., & Defourny, P. (2023). A 29-year time series of annual 300 m resolution plant-functional-type maps for climate models. Earth System Science Data, 15(3), 1465–1499. 10.5194/essd-15-1465-2023
- Mouginot, J., & Rignot, E. (2019). Glacier catchments/basins for the Greenland Ice Sheet. UC Irvine. 10.7280/d1wt11
- Mouginot, J., Rignot, E., Bjørk, A. A., van den Broeke, M., Millan, R., Morlighem, M., Noël, B., Scheuchl, B., & Wood, M. (2019). Forty-six years of Greenland Ice Sheet mass balance from 1972 to 2018. Proceedings of the National Academy of Sciences, 116(19), 9239–9244. 10.1073/pnas.1904242116
- Greene, C. A., Gardner, A. S., Schlegel, N.-J., & Fraser, A. D. (2022). Antarctic calving loss rivals ice-shelf thinning. Nature, 609(7929), 948–953. 10.1038/s41586-022-05037-w
- Morlighem, M. (2022). MEaSUREs BedMachine Antarctica, Version 3. NASA National Snow. 10.5067/FPSU0V1MWUB6
- Morlighem, M., Rignot, E., Binder, T., Blankenship, D., Drews, R., Eagles, G., Eisen, O., Ferraccioli, F., Forsberg, R., Fretwell, P., Goel, V., Greenbaum, J. S., Gudmundsson, H., Guo, J., Helm, V., Hofstede, C., Howat, I., Humbert, A., Jokat, W., … Young, D. A. (2019). Deep glacial troughs and stabilizing ridges unveiled beneath the margins of the Antarctic ice sheet. Nature Geoscience, 13(2), 132–137. 10.1038/s41561-019-0510-8
- Pritchard, H., Fretwell, P., Fremand, A., Bodart, J., Kirkham, J., Aitken, A., Bamber, J., Bell, R., Bianchi, C., Bingham, R., Blankenship, D., Casassa, G., Catania, G., Christianson, K., Conway, H., Corr, H., Cui, X., Damaske, D., Damn, V., … Zirizzotti, A. (2024). BEDMAP3 - Ice thickness, bed and surface elevation for Antarctica - gridding products. NERC EDS UK Polar Data Centre. 10.5285/2D0E4791-8E20-46A3-80E4-F5F6716025D2
- Pritchard, H. D., Fretwell, P. T., Fremand, A. C., Bodart, J. A., Kirkham, J. D., Aitken, A., Bamber, J., Bell, R., Bianchi, C., Bingham, R. G., Blankenship, D. D., Casassa, G., Christianson, K., Conway, H., Corr, H. F. J., Cui, X., Damaske, D., Damm, V., Dorschel, B., … Zirizzotti, A. (2025). Bedmap3 updated ice bed, surface and thickness gridded datasets for Antarctica. Scientific Data, 12(1). 10.1038/s41597-025-04672-y